I was an exercise logger long before I had heard the word “analytics.” I became a semi-serious recreational runner in 1996, and after a few months of paper logs, I’ve kept track of my running digitally. Early on, I used one of the first log apps, The Athlete’s Diary (which still appears to exist!), then for many years a modified Excel template created by a couple of people from the Dead Runners Society. Since switching to GPS watches, I’ve used a bunch. Currently I use and like Garmin Connect and Strava, as I wrote last week.
The analytics these new tools provide are impressive. But running is, in lots of ways, easy to be analytical on: There’s time and distance, and therefore speed. There’s effort, for which a heart rate is a pretty great proxy. Add terrain (from GPS or your own logging), cadence (from your watch’s accelerometer), and you can analyze and compare almost everything you do.
But what if you do different sports? Or, worse yet, sports that are very complex. When “constantly varied” is in the definition of a sport, as it is for CrossFit, my preferred version of “functional fitness,” you know it’s not going to be easy to figure out how one workout relates to another. What’s a boy to do?
- Nothing! Who cares! You go to the gym or wherever, do your thing, probably get more than the recommended weekly amount of exercise, know you’re healthier than 93.7% of the OECD population, and feel good. This is obviously good enough for many people, but I’m too obsessed with knowing what’s what.
- Rely on a coach. Great idea, but unless you get a personal trainer, which may be helpful but might not be sustainable, even the best coaches can offer only a partial view of your progress.
- Use benchmarks. This is what CrossFit does: it has benchmark workouts, which, ideally, you’ll do from time to time, to get a sense of your improvement. But benchmarks have two significant problems: One, you have to hope they capture the aspects of fitness you care about, in a healthy but representative way. In CrossFit, some do, while some are one-dimensional or, worse, reflect the particular idiosyncracies (or idiocies) of whoever came up with the workout. Two, with benchmarks, you can’t analyze all the stuff in between, in the way running analytics let you drill down on your workouts and not just on your races. So:
- Develop an analytics tool that deals with the complexity. You could try to do this yourself, perhaps incorporating known MET values (however imprecise they are, especially for some of these new combined exercise modalities), maybe heart rates, and generating some simple algorithms. But there are many tools already. I’ll talk about one here: Beyond the Whiteboard (BTWB).
Disclaimers first: I don’t know the people who created Beyond the Whiteboard, I have no personal stake in saying they are cool, and I don’t in fact love everything about BTWB. There are now about a bazillion apps even for something as complex as CrossFit and other functional fitness modalities. It’s possible some of the other available apps do this, too; I don’t know them all. I’m not trying to advertise BTWB as much as talk about why what it does is valuable and interesting.
I believe in logging your exercise purposefully. Logging what you have done is just the first part. You’ll want to be able to look at what you’ve done and how it matters, how it fits in your overall regimen, identify weaknesses and risk factors for overuse injuries. BTWB lets you analyze your performance on a workout, compare it to others, to your other times of performing the same workout, and to other very different workouts.
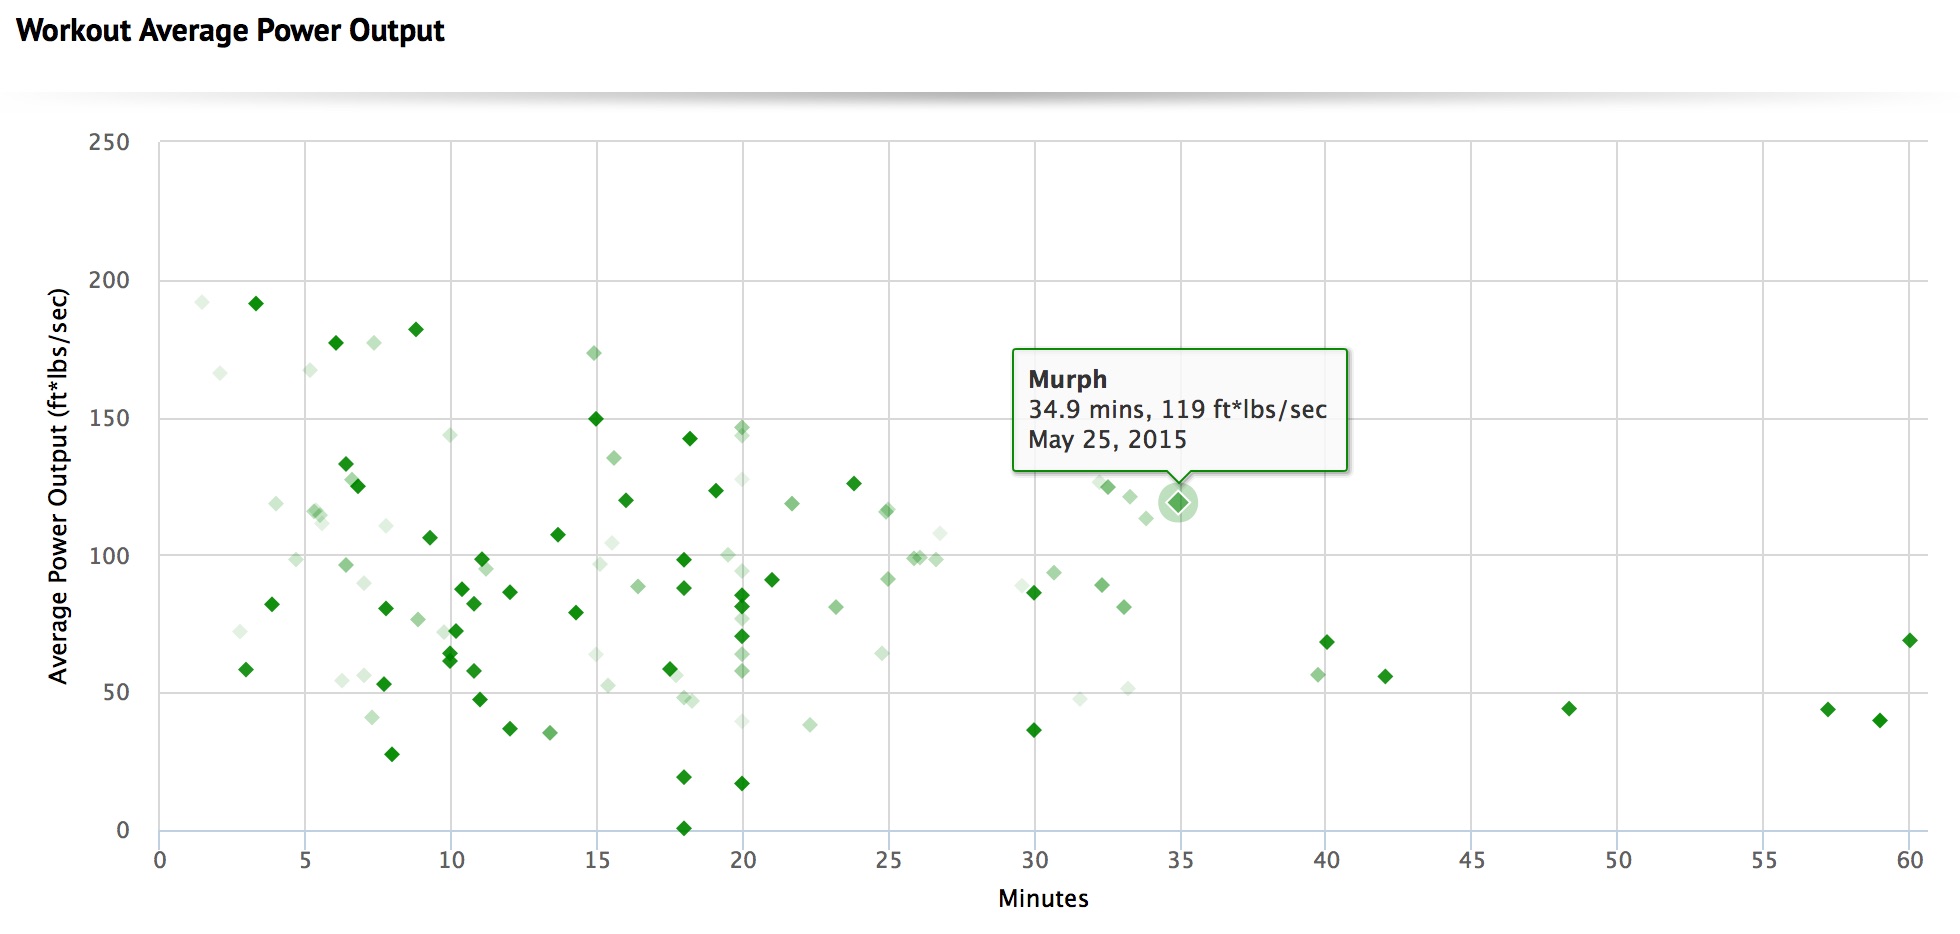
My different workouts plotted as a function of time and average power output. Darker dots are more recent workouts than lighter dots.
They do this with a couple of basic physics variables: mass (your body’s as well as that of what else you might be lifting), how far that mass gets moved, and time, to arrive at the average power output: ft * lb / sec, in imperial units. For precision, this requires you to provide not just your weight, but a bunch of basic measurements (how deep you squat, etc.), but it’s quite clever. They don’t use heart rate, for the obvious reason that most people don’t wear a heart rate monitor during CrossFit workouts, although of course this could change. And because the user base is pretty large and growing, their normative database of average difficulty of different common workouts also becomes a useful way of evaluating your performances.
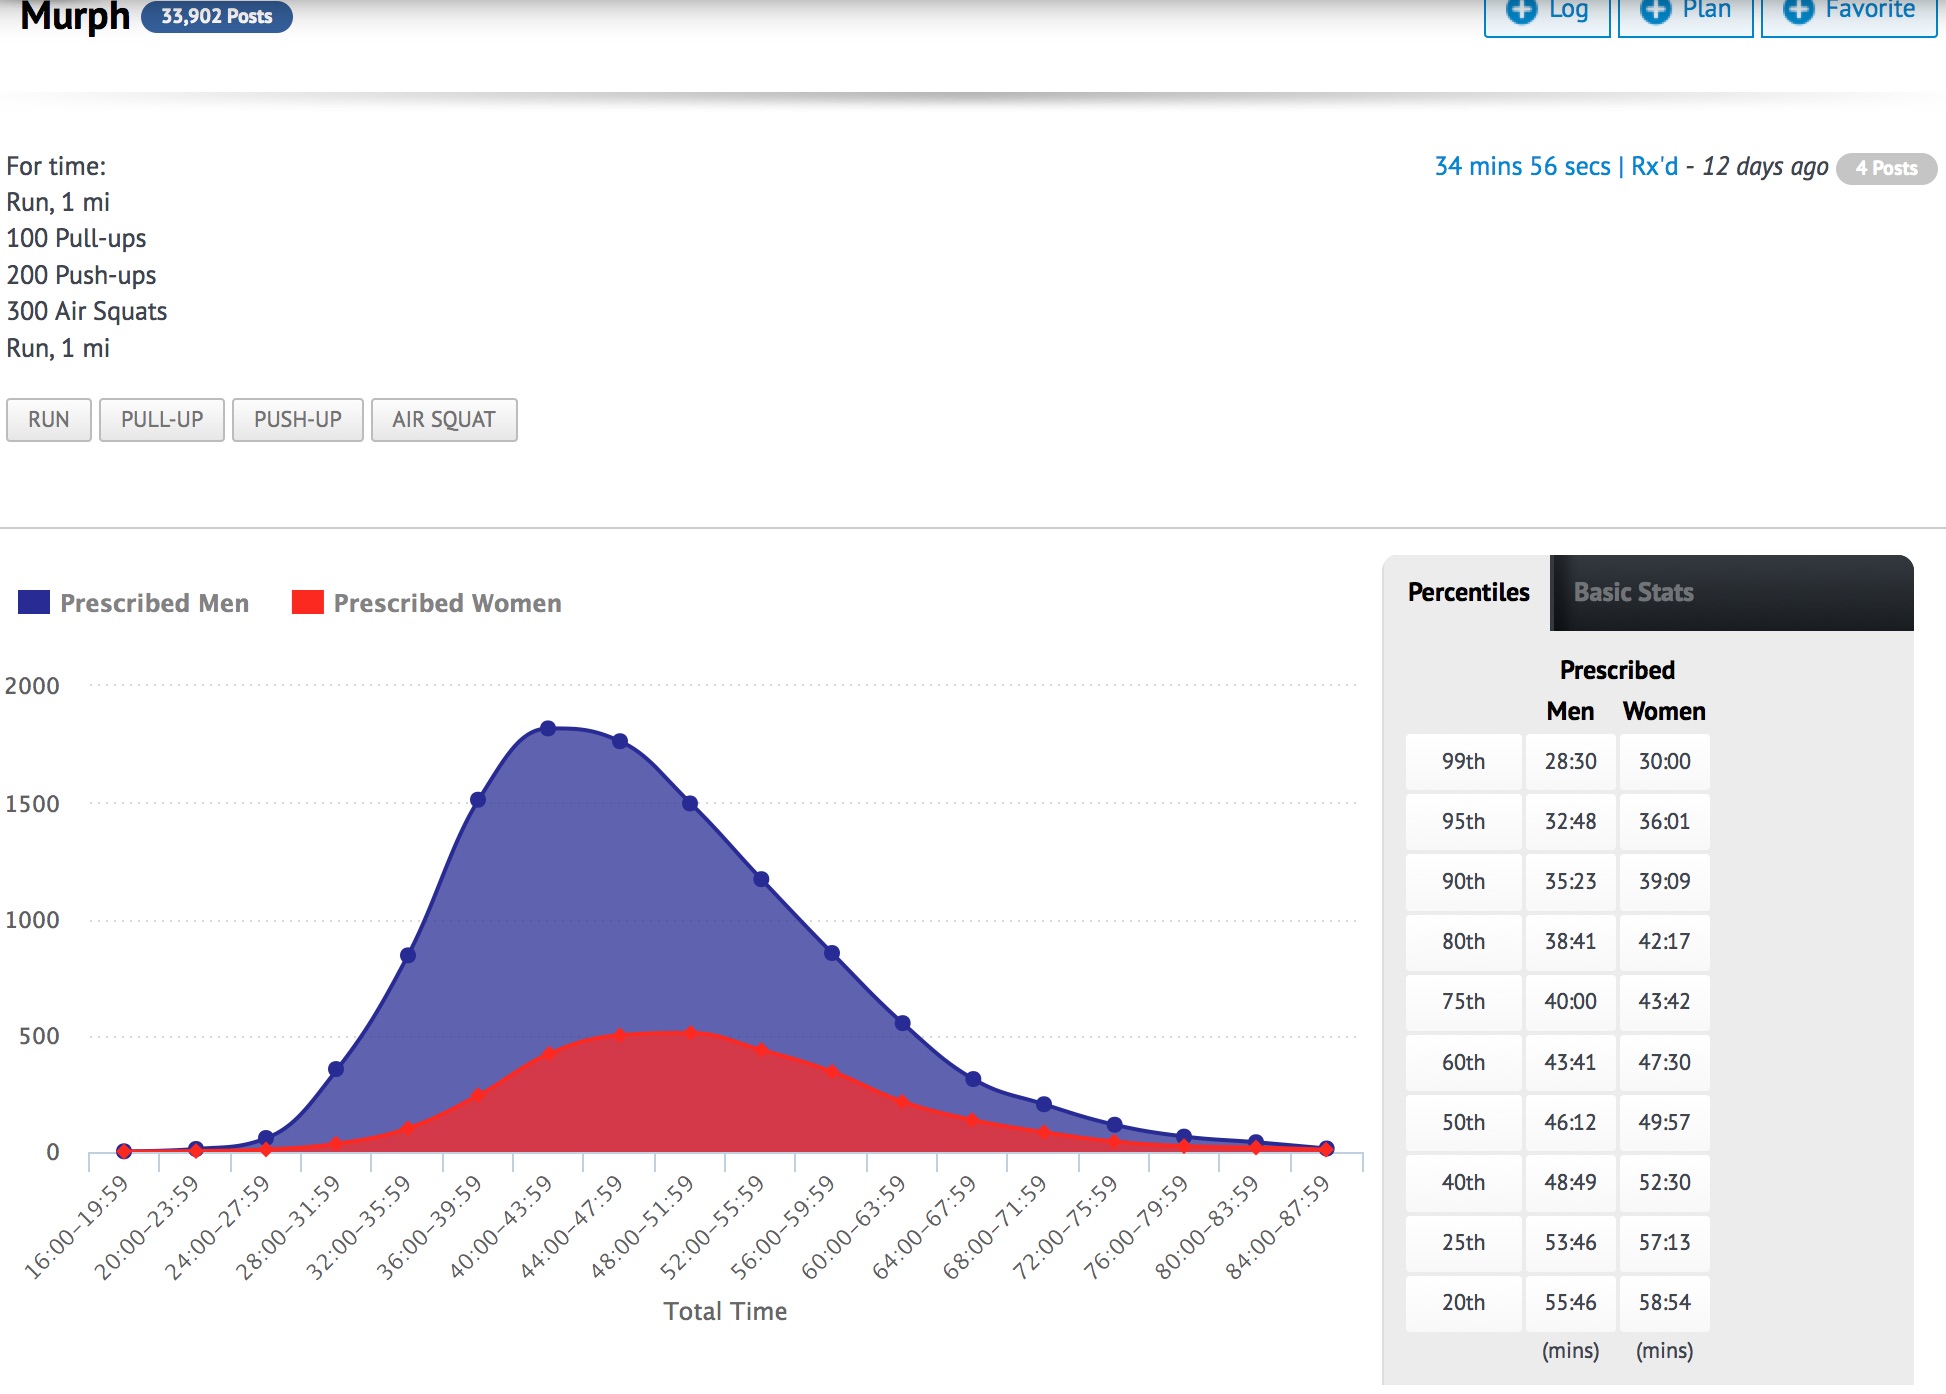
You can compare yourself to others who have completed the same workout as you have.
The irony even with such a powerful analytics tool as BTWB is that it’s really only good for the one exercise modality for which it was developed: CrossFit. Although you can log your running in it, the tool’s running analytics are poor — possibly because of CrossFit’s, um, controversial views about endurance training. So it doesn’t serve as a one-stop shop for anyone with multiple sports or exercise modalities.
Speaking of which, I haven’t said a word yet about rock climbing. I’ve yet to find a logging and analytics tool for that!
